Most marketing reporting measures activity, not profit. We connect every channel, campaign, and conversion back to revenue and contribution margin, so optimization decisions are based on what actually moves the business, not what platforms want you to see.


Trusted by 60+ growth-stage brands
Marketing performance is usually measured in clicks, impressions, and platform-reported ROAS. These metrics show activity, not profit. In many cases they improve while acquisition costs rise and margins decline. The issue is not a lack of data. It is the lack of alignment between marketing metrics and financial outcomes.
Most marketing dashboards default to activity metrics, which tell you what happened on the platform. They rarely tell you whether the platform made you money. The difference between activity and profit is the difference between a busy account and a profitable one. Below are the metrics that move the business, and the ones that don't.

True cost to acquire a customer across all channels, not just the platform-reported number. Reveals whether scaling spend is actually scaling profit or just inflating attribution.

Total revenue divided by total visitors, segmented by source. Shows which channels actually drive purchase value, not just clicks. The number that catches AOV-killing variants other metrics miss.

Revenue minus COGS minus acquisition cost, by channel and campaign. The only number that tells you whether marketing spend is actually paying for itself after the product ships.
Surface-level metrics rarely reflect profit. We evaluate marketing performance through contribution margin and revenue alignment: acquisition cost relative to AOV, margin by product, repeat purchase behavior, and revenue contribution by channel. The result is a clear view of which campaigns actually support sustainable growth.
See Our Methodology →Marketing data lives in fragments. Paid media dashboards say one thing, GA4 says another, the CRM says a third. We consolidate sources into one unified framework, validate tracking and attribution, and reconcile platform numbers with actual revenue. Resolving inconsistencies is the foundation for every reliable performance decision after.
Platform dashboards prioritize engagement metrics that rarely correlate with profit. We shift focus to metrics that directly impact the business: blended CAC, revenue per visitor, contribution margin by channel, and channel-level profitability. Reporting becomes a tool for decisions, not a vanity exercise.
See Our Analytics Stack →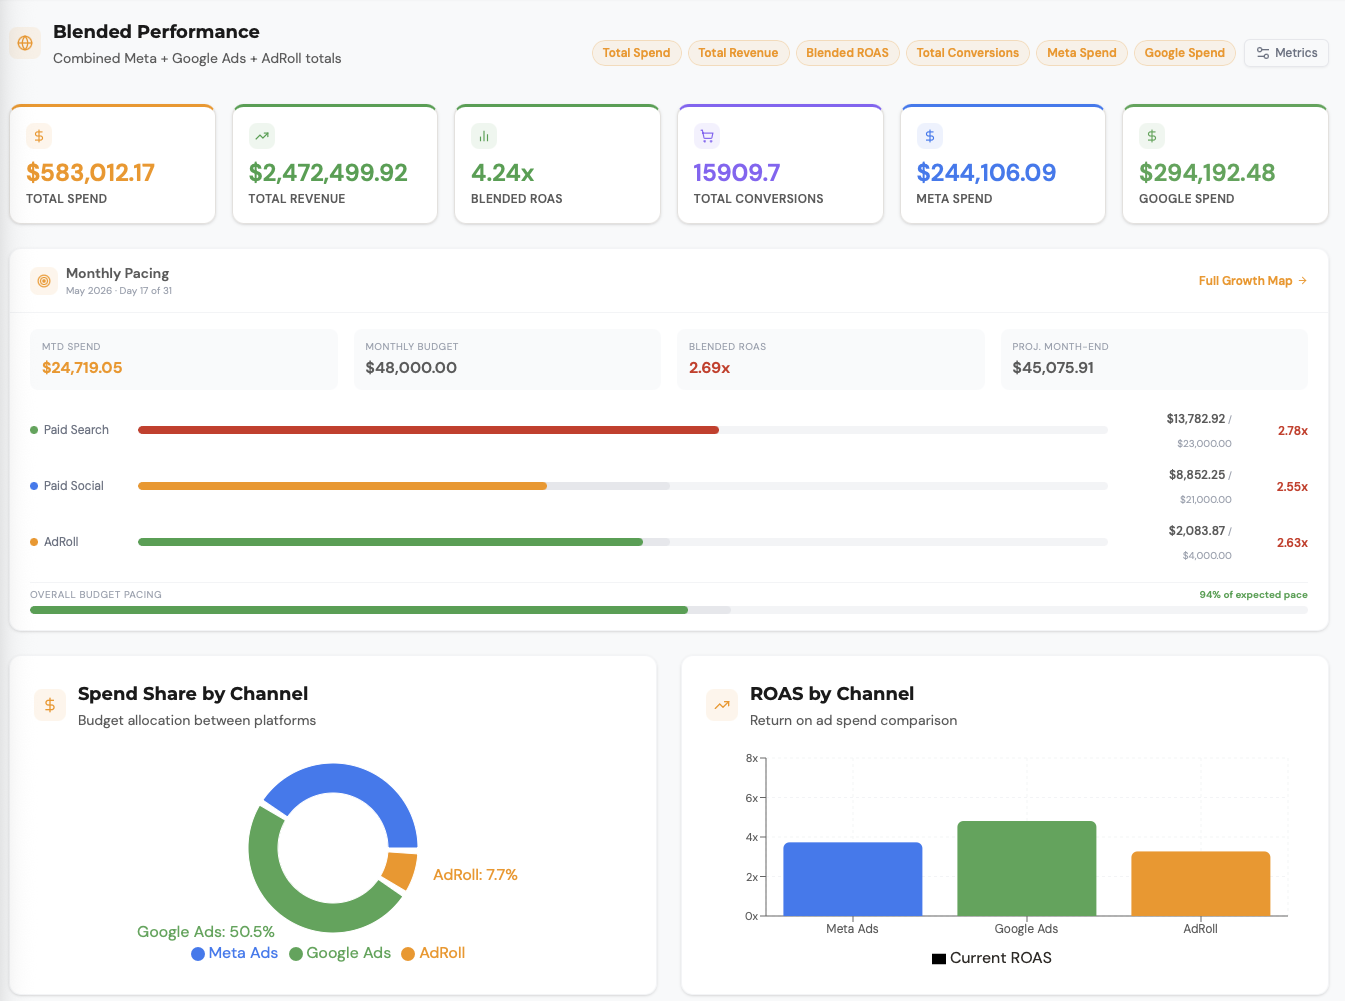
Data only matters if it leads to better decisions. We translate insights into action: budget reallocation based on revenue contribution, scaling decisions tied to profitability, audience optimization based on conversion quality, and channel prioritization based on actual efficiency. Capital efficiency replaces reactive optimization.
Quarterly budget reallocation based on revenue contribution per channel, not platform ROAS. Channels that compound margin get more. Channels that inflate vanity metrics get less.
Scaling decisions tied to sustained profitability signals, not single-day spikes. Budget increases follow CAC stability and contribution margin trends.
Audience targeting refined based on which segments produce profitable conversions, not just any conversion. AOV and repeat purchase patterns inform optimization decisions.
Channels ranked by contribution margin and capital efficiency, not just topline revenue. The winners get more budget. The losers get reallocated, not rationalized.
Each platform reports performance differently. Meta, Google, and TikTok all use different attribution windows, different conversion models, and different definitions of "success." We analyze every channel through a unified lens tied to actual user behavior and revenue impact. Cross-channel contribution replaces platform-reported outcomes as the source of truth.
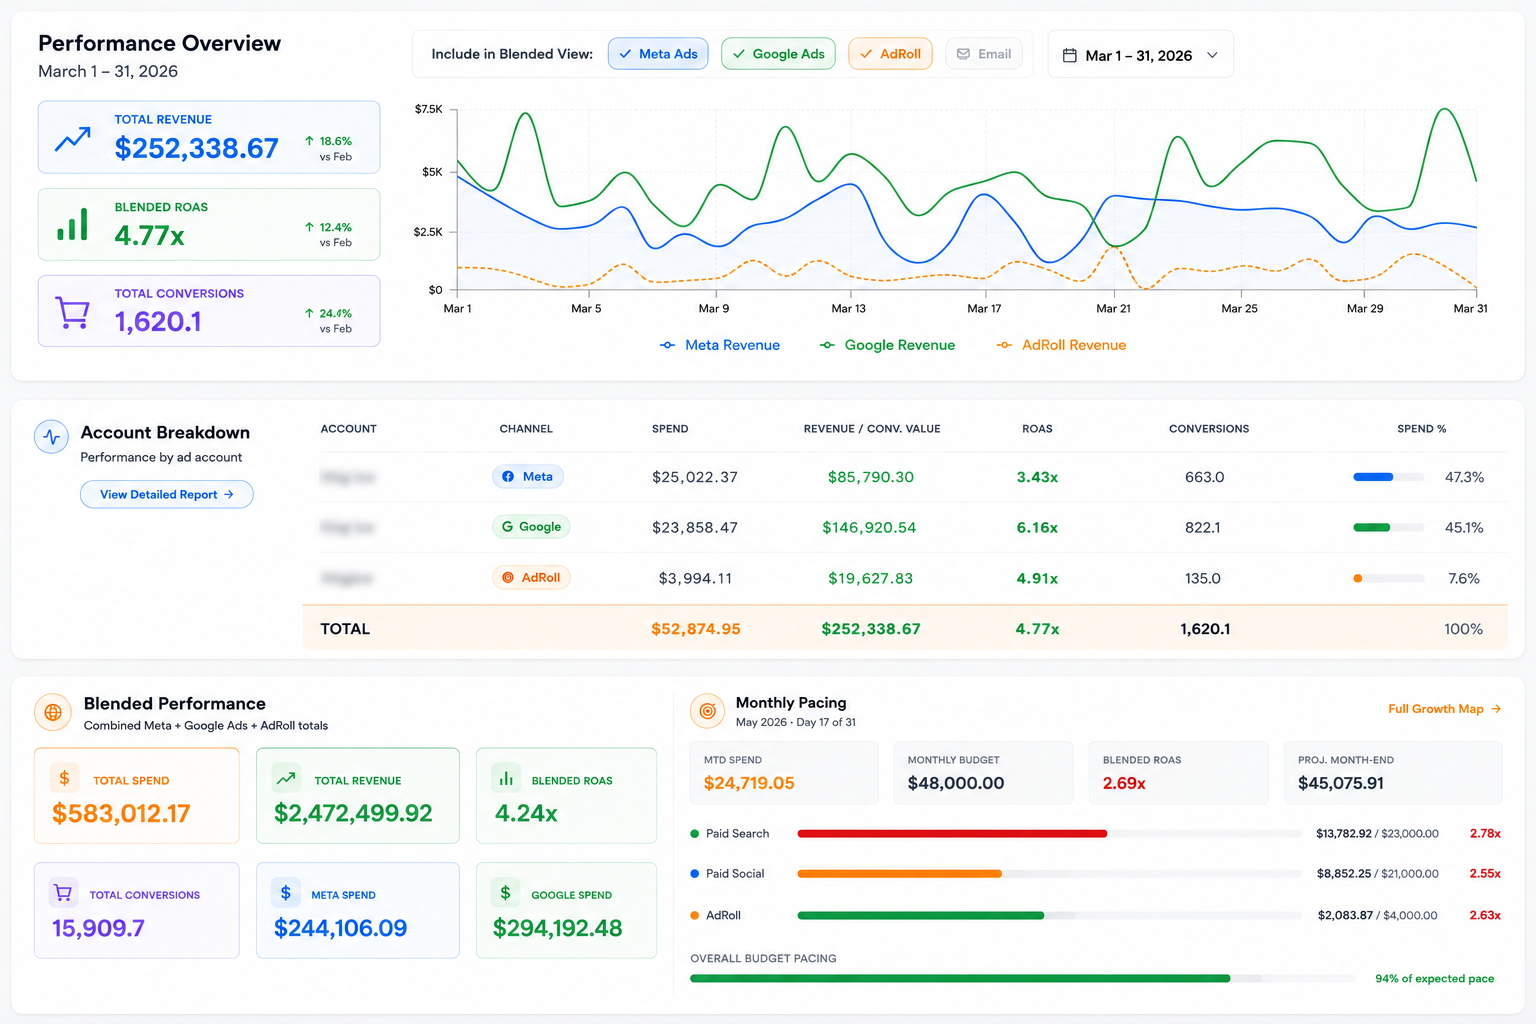
Cion's platform dashboards looked decent, but a unified analysis surfaced that their blended CAC was 60% higher than the platforms reported. Their channels were cannibalizing each other, and one was draining margin to subsidize ROAS in another. We rebuilt the reporting layer, surfaced the leak, and prioritized channel reallocation. The wins compounded into 90% revenue growth, 4.9x ROAS, and a 41% reduction in CPA. Clarity made every decision after.
Read the Full Case Study →
.png)

"We partnered with Lion Media 6–7 months ago to boost our marketing and sales, and since then we've seen a 3X increase in sales. Their creative strategies expanded our reach across all demographics and improved both online and print marketing efforts. Frank’s leadership has brought strong results, and we’re excited for continued growth."
"Working with the team at Lion Media has been essential for starting and growing my online business. Great work ethic, understanding of advertising industry and professional feedback is what you can expect at Lion media."
"We love being partners with Lion Media and will continue to do so."
"I cannot recommend Lion Media highly enough. Since working with Lion Media we've seen our top line revenue more than double."
Lion Media took over our marketing six months ago and tripled our revenue. Frank has worked tirelessly to get our CBD products on Meta and Pinterest, no small feat in this industry. We've been very happy with his service and congratulate him on his success.
"We work in highly regulated space, and paid channels are tough to navigate. LionsMedia handled it brilliantly, strategic, proactive, and always finding a way to make things work. Their entire team was responsive and great to work with"
Organic search channels that compound alongside paid reducing blended CPA over time.
Landing page and funnel optimization that maximizes the conversion rate of every ad click you pay for.
Static and video ad production built around testable hypotheses and systematic scaling of winners.
The data infrastructure that makes every optimization decision reliable not guesswork.
It means we evaluate marketing performance by what it contributes to the business, not what it triggers on the platform. Profit, margin, and customer value replace clicks, impressions, and platform ROAS as the metrics that drive decisions.
Platform ROAS captures conversions within a single platform's attribution window using that platform's view of the world. It cannot account for organic overlap, cross-channel contribution, refunds, returns, or actual margin. Blended CAC and contribution margin show what platform ROAS hides.
Blended CAC, contribution margin by channel, revenue per visitor, AOV trends, repeat purchase rate, and channel-level profitability. Activity metrics like clicks and ROAS still appear in reports for context, but they do not drive decisions.
We pull COGS, AOV, refund rates, and repeat purchase data from Shopify, Recharge, or your ERP, then reconcile it against ad spend and acquisition data from Meta, Google, TikTok, and GA4. The output is a unified view of marginal profitability per channel and campaign.
We compare platform-reported conversions against GA4, server-side tracking, and actual Shopify orders. Discrepancies get flagged, sourced, and quantified. We do not try to make Meta and Google match each other. We make both reconcile against the source of truth: actual revenue.
Attribution audit, tracking validation, contribution margin analysis, channel efficiency evaluation, cross-platform reporting alignment, and a custom dashboard that ties marketing activity to revenue. The deliverable is a framework you can run on quarterly without us in the room.
Attribution accuracy, blended CAC versus platform CAC, contribution margin by channel, conversion behavior, tracking integrity, and data consistency across sources. The audit surfaces the gaps that are costing you visibility and the decisions those gaps are likely distorting.
If your campaigns generate activity but profitability is unclear, the problem is reporting structure, not the campaigns. We will audit attribution accuracy, surface where platform numbers diverge from actual revenue, and show you what it would take to build reporting you can scale decisions on.
All engagements begin with a structured audit. Recommendations are based on documented data, not assumptions. No hard sell, no long-term lock-ins after onboarding.
.png)